Serving Series 9: Implementing an Approach
- Cal Pringle
- Jan 13, 2023
- 4 min read
Updated: Feb 3, 2023
Previous post: Serving Series 8: Developing an Approach with Experimental Design
In my last post I wrote about how to use experimental design to develop an approach. In this post, I’ll talk about how to implement that approach. I’ll speak to questions like “I know the distribution of results I can expect from each level of aggression from each athlete, so what?”
From the experiments in the last post, you can acquire an expectation for what results a given level of aggression will generate. However, this information is insufficient to create a serving approach. We need to pair that information to the expected points (xP) of those results so that we can pair a level of aggression to a situation. “I will use X aggression in A situation and Y aggression in B situation …” is a serving approach.
There are a variety of ways to approximate xP. If you don’t have volleymetrics, you might just use the aggregated numbers from Chad Gordon’s blog. If you have volleymetrics, you might aggregate your own data somehow. That could be measuring the xP of a certain outcome by an upcoming opponent in a certain rotation, that could be measuring the xP of a certain outcome by your conference as a whole, that could be measuring the xP of teams ranked similarly to an upcoming opponent. There are benefits and costs to more general and more specific data.
If you’re using more general data, it will be less noisy but less particular. If you’re using more specific data, it will be more noisy but more particular. If your upcoming opponent has an All-American outside hitter who hits in 2-hitter rotations, they might side out better in those rotations than the conference as a whole. So you lose some accuracy in prediction with lack of specificity. But, your upcoming opponent may have had a good or bad stretch of matches that makes their data noisy. Chad Gordon posted a blog where he notes that in a few-match stretch his high-school team was hitting worse on perfect passes than 2 passes because his middles had a rough stretch and they got set more on perfect passes. If a stretch like this is a significant chunk of your specific data, you lose some accuracy in prediction with specificity.
I think this is a case-by-case problem and don’t have any general prescriptions for how to solve it. Here are a few things I would suggest: Look at all the data. Check out how your upcoming opponent does in certain situations and then check out how peer institutions do in those situations. Then, if there are significant differences, see if there’s an explanation. Do they have an elite hitter that makes them more efficient in 2-hitter rotations than peer institutions? Are they more efficient out-of-system in a way that makes you expect that to continue? Do they have a significantly stronger back row in certain rotations? If you’re lacking an explanation for why a particular team is significantly different from their peers, you might make decisions based on the assumption that they will behave like their peers in the future, rather than continuing their outlier behavior. If you have an explanation for why a particular team is significantly different from their peers, you might make decisions based on the assumption that they will continue to behave differently.
Once you have xP data, you can fit approaches to situations. I’ll work through a contrived example. I don’t have any real data to work through this with so I’ll use some made-up numbers with the all-or-nothing server example from previous blogs.
First I took Chad Gordon’s aggregated numbers to come up with rough xP for each outcome for an average side-out situation. Then I tweaked those numbers to get rough xP for each outcome for a strong side-out situation and a weak side-out situation. For some examples: an average side-out situation might be a 3-hitter situation with the weaker-scoring outside in the front row, a strong side out rotation might be a 3-hitter situation with the stronger-scoring outside in the front row, a weak side-out situation might be a 2-hitter situation with the weaker-scoring outside in the front row.
Here are the numbers I came up with:

If you had real volleymetrics data you could calculate the xP in the manner I discussed before for each archetype that you want to sort discrete attempts into.
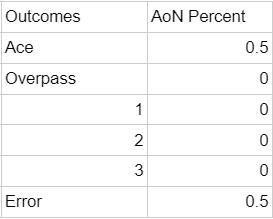
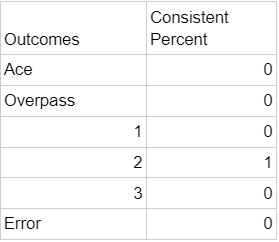
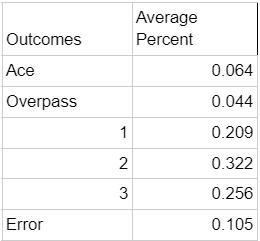
Then, you can combine the data that you generate in your practice data collection with match data on how your opponents side out from various outcomes in various situations to choose how to serve them in those situations. In lieu of fake practice data I’ll use the thought experiment from earlier in the series of the all-or-nothing server and the always-2-pass server, as well as Gordon's aggregate data:
The all-or-nothing server’s shape looks like this:
The always-2-pass server’s shape looks like this:
The average passer in Gordon's dataset looks like this:
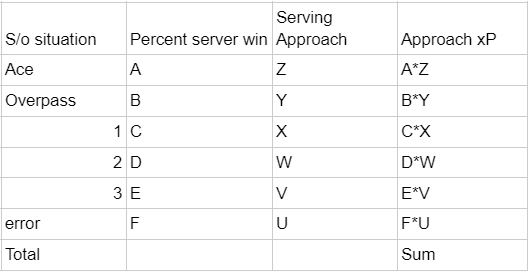
To find xP for an approach in a situation we can multiply the frequency of an outcome from the serving shape with the xP of that outcome from the serve receive xP table.
The formula looks like this:
Now we can apply that formula to our thought experiment to see what it says:
Our all-or-nothing server’s situation looks like this:
(Their total xP is always going to be .5)
Our always-2-pass server’s situation looks like this:
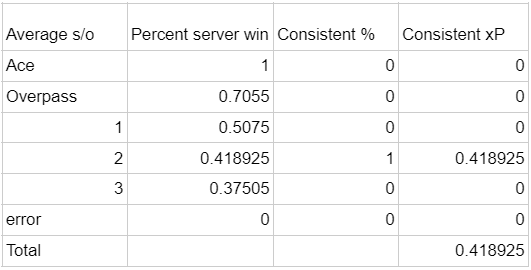
0.4189
(Their total xP is always going to be the xP for a 2 pass)
The average server in Gordon's dataset looks like this:
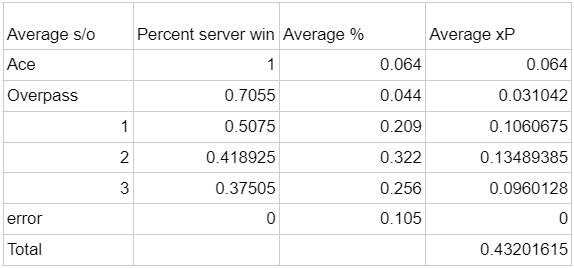
.4320
This is closer to what an actual athlete's situation would look like.
So, if these xP numbers are close to accurate, against an average side out situation the all-or-nothing approach is better than an always-2-pass approach by over 8 percentage points and is better than the average server in Gordon's dataset by close to 7 percentage points. This means that in a close match where a half of your serves come against strong side out situations, the always-2-pass approach is worse by about a point and the average server is worse by almost a point.
This doesn’t really say anything about how your team should behave because none of your athletes serve like the thought-experiment servers and very few probably serve exactly average. But, it’s an example of how to use the data I’ve been talking about and what kind of information it can give you.
This week's craiyon.com prompt: van gogh painting of a volleyball player talking to a volleyball coach


Comments